The problem
The client was tracking revenue and expenses by hand, using written records with no running picture of the business. At the end of each month, someone had to manually total everything to work out whether they'd made a profit or a loss. It worked, but it was slow, error-prone, and told them nothing until the month was already over.
Decisions that mattered
Optimized for zero training time
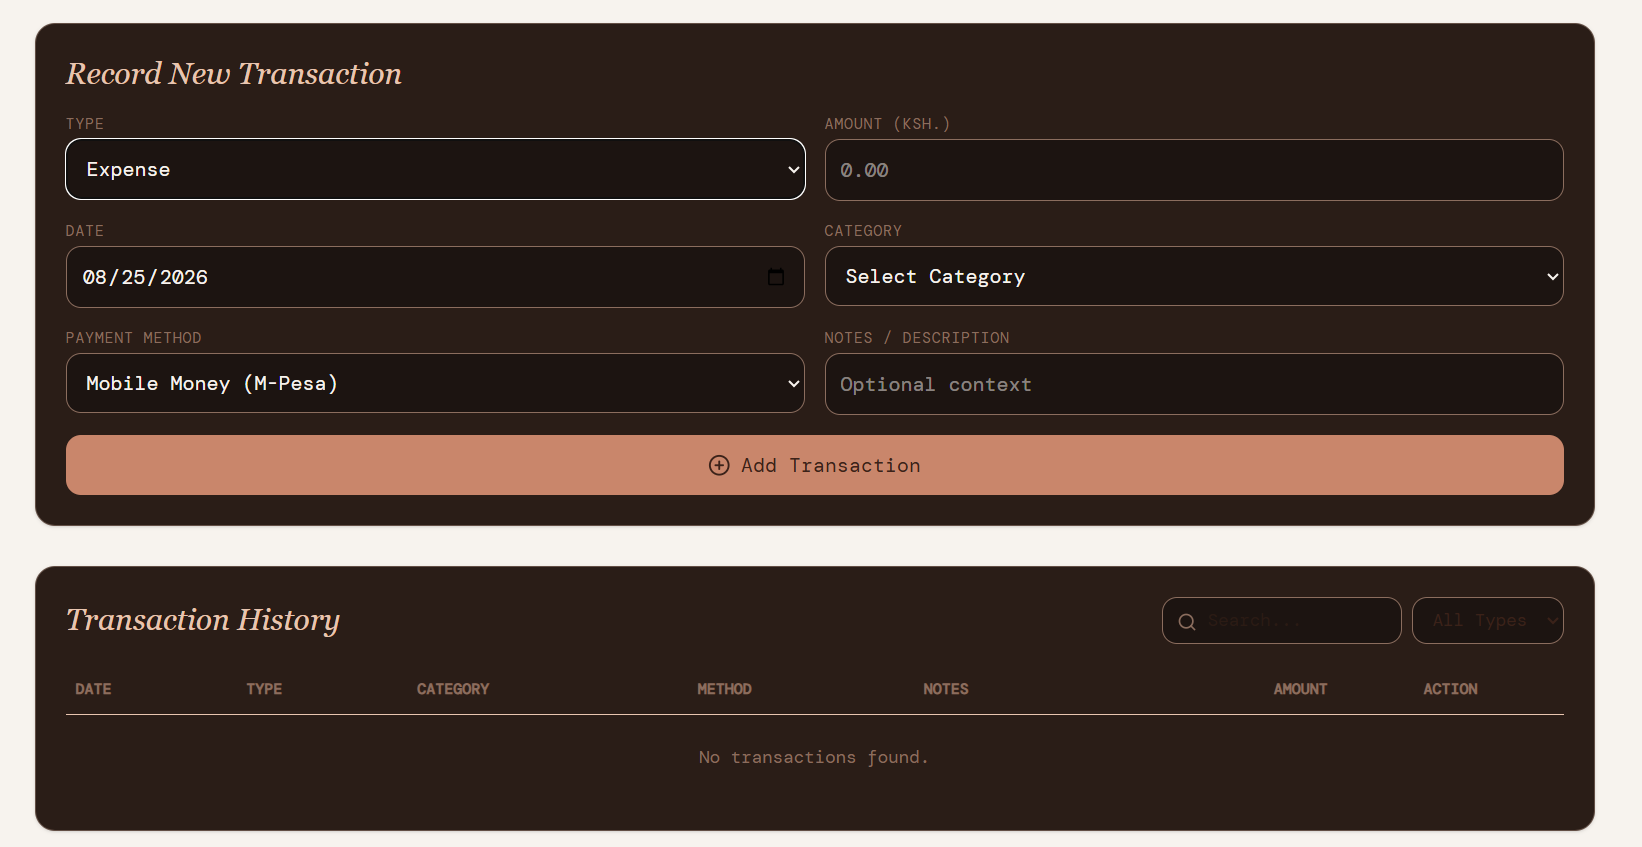
The interface was built around one core loop: log an entry, watch the number move. No accounting jargon, no configuration screens, no step the client had to think twice about. If a feature required an explanation, it was cut or simplified until it didn't.
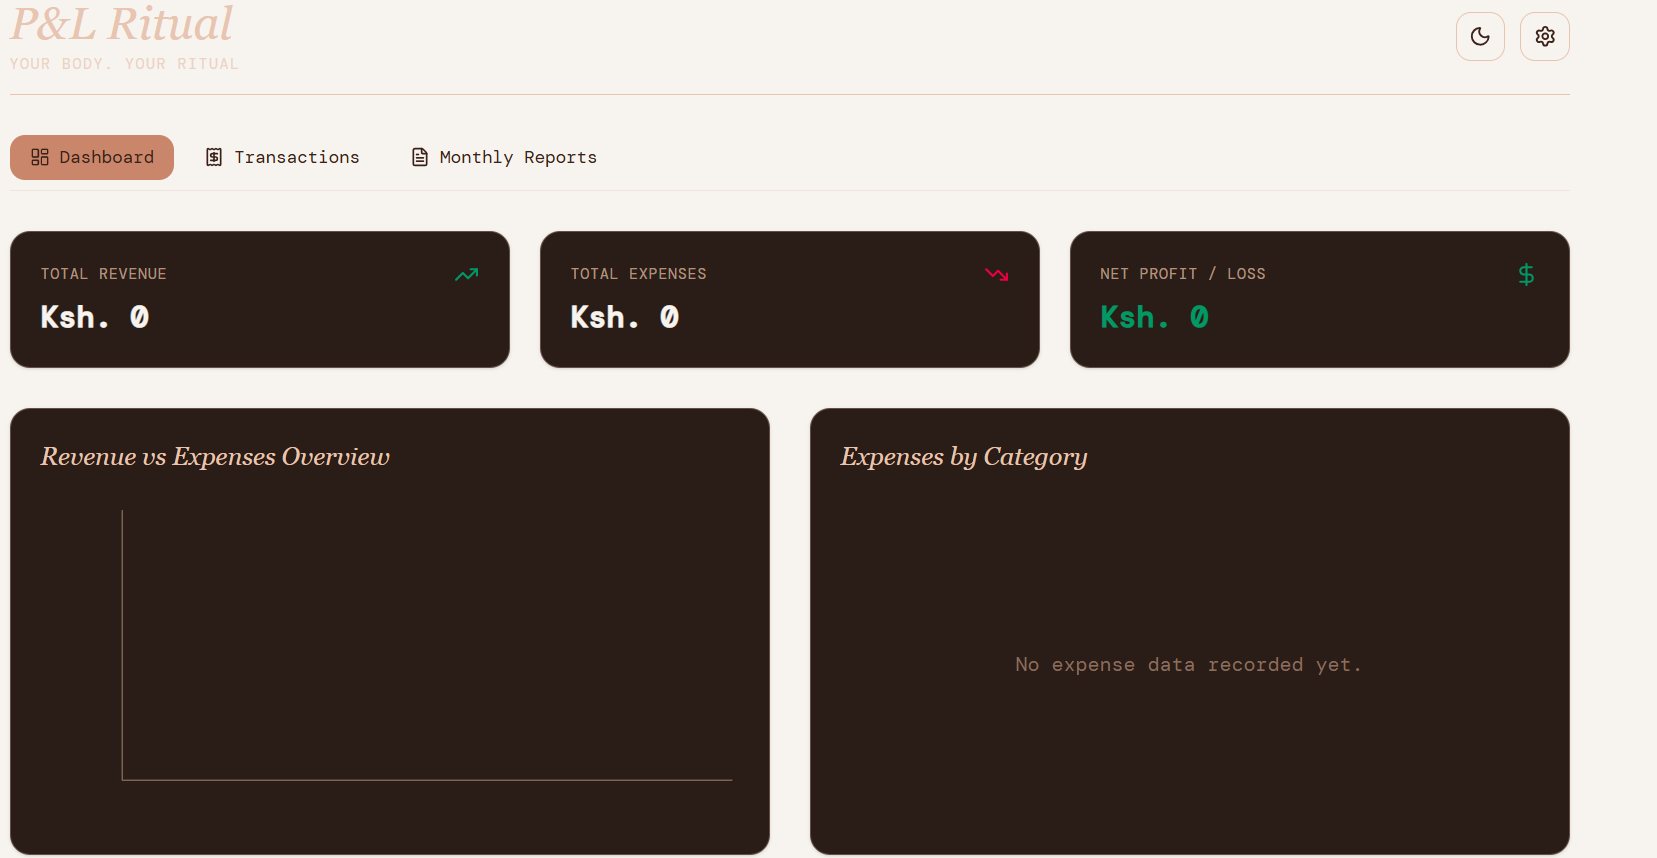
Real-time P&L, not month-end math
Instead of totaling figures manually at month close, the app calculates profit and loss continuously as entries are logged, so the client sees where they stand at any point, not just in arrears.
The outcome
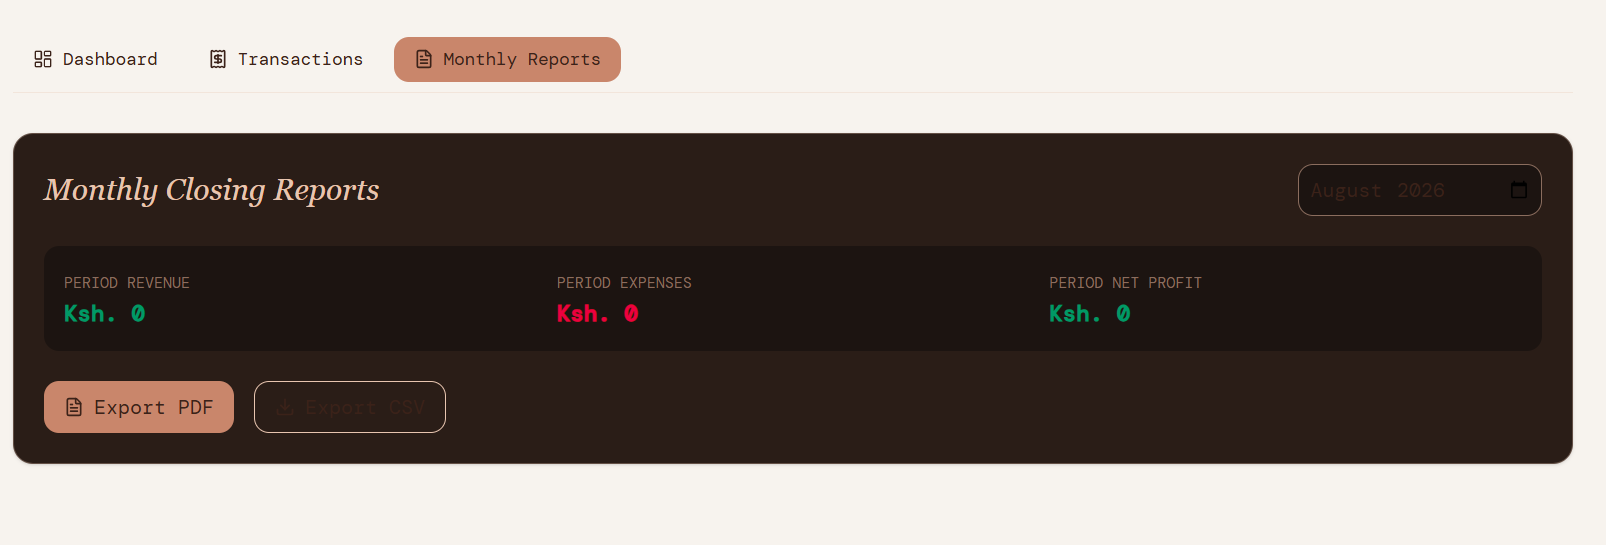
Manual, handwritten logging was eliminated entirely. The client no longer spends time at month-end reconciling paper records. The number is already there. The time saved compounds every single month.